Protected: Weather from Microsoft Start ForecastWatch Report January–December 2023
Microsoft Shopping:Terms and Details
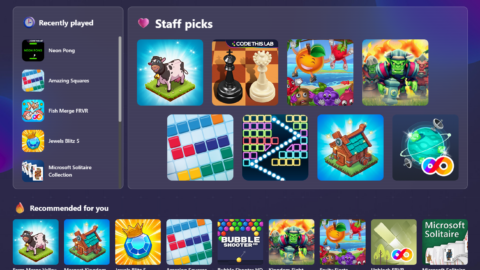
Celebrate the 1-Year Anniversary of Games from Microsoft Start
Follow the FIFA Women’s World Cup with Microsoft Start